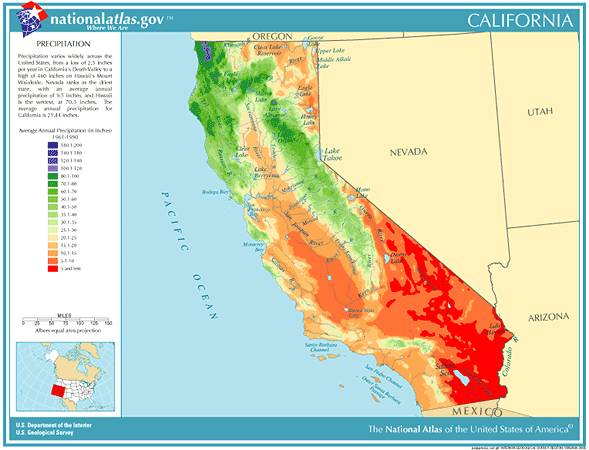
 California
Annual Rainfall and Climate Data, see below for individual
cities
California
Annual Rainfall and Climate Data, see below for individual
cities
California
Annual Rainfall and Climate Data, see below for individual
cities
California city precipitation totals
| City |
Avg Annual Precip |
Avg Annual Snow |
Avg. # days of Precip |
Avg # thunderstorm days |
Avg # hail days | Avg annual wind/highest record wind | # of tornadoes reported in county, 1960-2010 |
|
| Bakersfield | 6.49 | 0.0 | 37 | 2 | 0 | 6.4 / 49 mph | 12 | |
| Bishop | 5.02 | 8.2 | 29 | 32 | 0 | 10.0 / 70 mph | 0 | |
| Blue Canyon | 68.00 | 240.0 | 90 | 12 | 0 | 6.7 / 76 mph | 0 | |
| Eureka | 38.10 | 0.2 | 117 | 4 | 1 | 6.8 / 56 mph | 0 | |
| Fresno | 11.23 | 0.1 | 44 | 5 | 1 | 6.4 / 39 mph | 23 | |
| Long Beach | 12.94 | 0.0 | 32 | 1 | 0 | 6.2 / 44 mph | 40 | |
| Los Angeles | 13.15 | 0.0 | 35 | 1 | 0 | 7.5 / 62 mph | 40 | |
| Mount Shasta | 39.16 | 104.9 | 93 | 13 | 0 | 5.1 / 24 mph | 0 | |
| Redding | 33.52 | 4.2 | 75 | 11 | 1 | 6.6 / 64 mph | 1 | |
| Sacramento | 17.93 | 0.0 | 58 | 2 | 1 | 7.8 / 74 mph | 10 | |
| San Diego | 10.77 | 0.0 | 42 | 5 | 0 | 7.0 / 56 mph | 25 | |
| San Francisco | 13.15 | 0.0 | 66 | 5 | 1 | 10.6 / 58 mph | 0 | |
| Santa Barbara | 16.93 | 0.0 | 31 | 6 | 0 | 6.0 / 45 mph | 5 | |
| Santa Maria | 14.01 | 0.0 | 45 | 2 | 0 | 6.9 / 46 mph | 5 | |
| Stockton | 13.84 | 0.0 | 51 | 1 | 0 | 8.0 / 47 mph | 18 | |
|
||||||||
California Precipitation Records
- California's wettest year ever was 1983, with a state precipitation average of 42.33 inches. 45 weather reporting stations received levels of precipitation that normally occur only 1 time in over 1,000 years.
- California possesses two cities that are among the Top 5 driest cities in the nation: Bishop and Bakersfield
- On August 13, 2012 Needles, California endured a brutal heat wave and tied its all-time high of 118 degrees. At 4PM, rain began to fall in the city while the temperature was 115 degrees, breaking the world record for hottest rainfall. The previous hottest rain was at Mecca, Saudi Arabia with 109 degrees on June 5, 2012 and Marrakech, Moroccowith with 109 on July 20, 2010.
California temperature averages and extremes, Top 10 California and U.S. cities in climate extremes, Los Angeles, San Francisco,
San Diego and San Jose averages/extremes, California average freeze dates and precipitation/temperature data for all U.S States
Data sources: National Climatic Data Center, Severe thunderstorm / tornado watch data period is 1999 - 2008, NOAA Storm Prediction Center, Tornado climate data -
NOAA Storm Prediction Center, State lightning flash density average - 1997-2011, Vaisala
 Custom Search