 Connecticut
Annual Rainfall and Climate Data, see below for
individual
cities
Connecticut
Annual Rainfall and Climate Data, see below for
individual
cities
Connecticut
Annual Rainfall and Climate Data, see below for
individual
cities
Connecticut
city
precipitation totals
| City |
Avg Annual Precip |
Avg Annual Snow |
Avg # days w/ Precip | Avg # thunderstorm days | Avg # hail days | Avg # severe thunderstorm watches per year | Avg # tornado watches per year | # of tornadoes reported in county, 1960-2010 |
| Bridgeport | 44.15 | 26.4 | 118 | 22 | 1 | 0 | 10 | 12 |
| Hartford | 46.16 | 50.3 | 127 | 20 | 1 | 0 | 8 | 12 |
|
||||||||
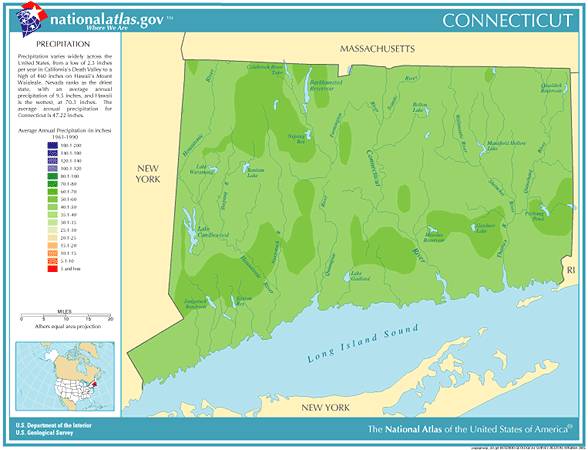
Connecticut Precipitation Data
- Driest location ranked by lowest annual average precipitation: Bridgeport, southeast Connecticut, 44.15"
- Wettest location ranked by highest annual average precipitation: West Hartford, central Connecticut 56.93"
- Snowiest location ranked by highest annual average snowfall: Norfolk, northwest Connecticut
- State precipitation record for 24 hours - Burlington, central Connecticut, 8/19/1955, 12.77"
- State precipitation record for 1 year - Burlington, central Connecticut, 1955, 78.53"
- State snowfall record for 24 hours - New Haven, southern Connecticut, 28.0", 3/12/1888
- State snow record for 1 season - Norfolk, northwest Connecticut, 177.4", 1955-1956
- Connecticut temperature averages and extremes, precipitation and temperature data for all U.S. states and Top 10 U.S. climate extremes
Data sources: National Climatic Data Center, severe thunderstorm / tornado watch data period is 1999 - 2008, NOAA Storm Prediction Center, Tornado climate data - NOAA Storm Prediction Center, State lightning flash density average - 1997-2011, Vaisala
Data sources: National Climatic Data Center, severe thunderstorm / tornado watch data period is 1999 - 2008, NOAA Storm Prediction Center, Tornado climate data - NOAA Storm Prediction Center, State lightning flash density average - 1997-2011, Vaisala
Data sources: National Climatic Data Center, severe thunderstorm / tornado watch data period is 1999 - 2008, NOAA Storm Prediction Center, Tornado climate data - NOAA Storm Prediction Center, State lightning flash density average - 1997-2011, Vaisala