![]() Illinois
Annual
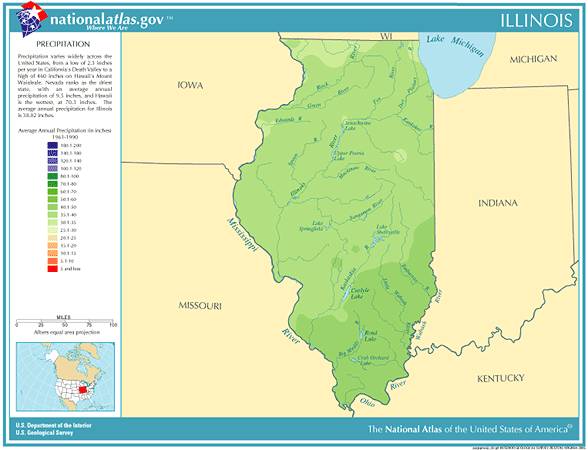
Rainfall and Climate Data, see below for
individual
cities
Illinois
Annual
Rainfall and Climate Data, see below for
individual
cities
Illinois city precipitation totals
| City |
Avg Annual Precip |
Avg Annual Snow |
Avg. days of Precip | Avg # snow days | Avg # thunderstorm days | Avg # hail days | Avg # severe thunderstorm watches per year | Avg # tornado watches per year | # of tornadoes reported in county, 1960-2010 |
| Chicago | 36.27 | 38.0 | 126 | 69 | 38 | 2 | 4 | 13 | 41 |
| Moline | 38.04 | 30.5 | 114 | 51 | 46 | 1 | 6 | 15 | 17 |
| Peoria | 36.03 | 25.0 | 114 | 50 | 30 | 2 | 7 | 15 | 20 |
| Rockford | 36.63 | 34.5 | 118 | 70 | 43 | 2 | 4 | 12 | 9 |
| Springfield | 35.56 | 23.1 | 114 | 50 | 50 | 1 | 7 | 14 | 69 |
|
|||||||||
Illinois Precipitation Records
- Driest location ranked by lowest annual average precipitation: Waukegan, northern Illinois, 32.32"
- Wettest location ranked by highest annual average precipitation: Rosiclare, southern Illinois, 104.18"
- Snowiest location ranked by highest annual average snowfall: Chicago Midway Airport, northern Illinois, 42.8"
- State precipitation record for 24 hours - Aurora, northeastern Illinois, 7/17-18/1996, 16.94"
- State precipitation record for 1 year - New Burnside, southern Illinois, 1950, 74.58"
- State snowfall record for 24 hours - Astoria, western Illinois, 7/17-18/1996, 16.94"
- State snow record for 1 season - Antioch, northeastern Illinois, 1978-1979, 103.3"
- On 01/31/1982, a major snowstorm struck Illinois. Twenty-five inches of snow was recorded at Greenville, Illinois
located east of Saint Louis. The storm left 4,000 motorists stranded for two days
- Winter snowfall is heaviest in the Chicago area, enhanced by lake-effect snows from Lake Michigan.
- The number of annual days in Illinois with an inch or more of precipitation averages 11 days and the number of days
with an inch or more of snow averages 8 days
- On April 2, 1975 the biggest snowstorm of record for so late in the season paralyzed Chicago, IL. Up to 20 inches of
snow fell in extreme northeastern Illinois, and 10.9 inches of snow closed Chicago's O'Hare Airport.
- Flood losses in Illinois - $257 million annually since 1983 - are the third highest in the nation. Illinois temperature
averages and extremes, Chicago climate records, precipitation and temperature data for all U.S. states and
interesting Top 10 U.S. climate extremes
Data sources: National Climatic Data Center, Severe thunderstorm / tornado watch data period is 1999 - 2008, NOAA Storm Prediction Center, Tornado climate data - NOAA Storm Prediction Center
State lightning flash density average - 1997-2011, Vaisala
 Custom Search
|