 Iowa Annual
Rainfall and Climate Data, see below for individual
cities
Iowa Annual
Rainfall and Climate Data, see below for individual
cities
Iowa Annual
Rainfall and Climate Data, see below for individual
cities
Iowa city precipitation totals
| City |
Avg Annual Precip |
Avg Annual Snow |
Avg # days of Precip |
Avg # snow days |
Avg # thunderstorm days |
Avg # hail days |
Avg # severe thunderstorm watches per year |
Avg # tornado watches per year |
# of tornadoes reported in county, 1960-2010 |
| Des Moines | 34.72 | 31.8 | 108 | 64 | 46 | 2 | 7 | 16 | 47 |
| Dubuque | 35.52 | 42.1 | 117 | 62 | 35 | 2 | 6 | 14 | 20 |
| Sioux City | 25.99 | 32.0 | 99 | 63 | 43 | 2 | 7 | 15 | 47 |
| Waterloo | 33.15 | 31.8 | 103 | 63 | 41 | 1 | 7 | 14 | 33 |
|
|||||||||
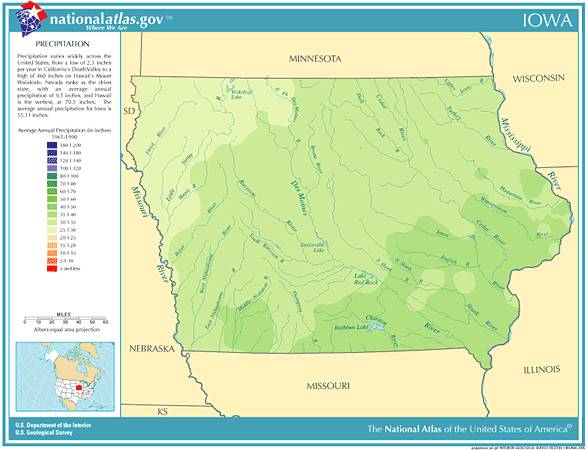
Iowa Precipitation Records
- Driest location ranked by lowest annual average precipitation: Akron, northwest Iowa, 25.81"
- Wettest location ranked by highest annual average precipitation: Lamoni, southern Iowa, 39.37"
- Snowiest location ranked by highest annual average snowfall: Dubuque, eastern Iowa, 43.8"
- State precipitation maximum for 24 hours - Decatur county, southern Iowa, 8/5-6/1959, 16.70"
- State precipitation maximum for 1 year - Muskatine, southeast Iowa, 1851, 74.50"
- State snow maximum for 24 hours - Sibley, northwest Iowa, 2/18/1962, 21.0"
- State snow maximum for 1 season - Northwood, northern Iowa, 1908-1909, 90.4"
- On May 28, 1942, the latest snowstorm of record for the state of Iowa left 10 inches at LeMars,
8 inches at Cherokee, and 7.5 inches at Waukon. Afternoon highs were in the lower 30s in parts of
northwetstern Iowa
- On July 14, 1987, severe thunderstorms in Iowa produced eight inches of golf ball size hail near
Grafton, Iowa, completely stripping corn stalks in the area.
- Iowa temperature averages and extremes, precipitation and temperature data for all U.S. states
and Top 10 U.S. climate extremes
Data sources: National Climatic Data Center, severe thunderstorm / tornado watch data period is 1999 - 2008, NOAA Storm Prediction Center
Tornado climate data - NOAA Storm Prediction Center, State lightning flash density average - 1997-2011, Vaisala