 Kansas Annual
Rainfall and Climate Data, see below for individual
cities
Kansas Annual
Rainfall and Climate Data, see below for individual
cities
Kansas Annual
Rainfall and Climate Data, see below for individual
cities
Kansas city precipitation totals
| City |
Avg Annual Precip |
Avg Annual Snow |
Avg # days of Precip |
Avg # Thunderstorm days |
Avg # Hail days |
Avg # severe thunderstorm watches per year |
Avg # tornado watches per year |
# of tornadoes reported in county, 1960-2010 |
| Concordia | 28.43 | 21.9 | 90 | 57 | 3 | 8 | 15 | 32 |
| Dodge City | 22.35 | 19.9 | 78 | 40 | 3 | 8 | 16 | 63 |
| Goodland | 19.76 | 37.4 | 77 | 46 | 5 | 5 | 16 | 90 |
| Topeka | 35.64 | 20.4 | 97 | 54 | 3 | 7 | 15 | 33 |
| Wichita | 30.38 | 15.9 | 86 | 54 | 3 | 9 | 17 | 21 |
|
||||||||
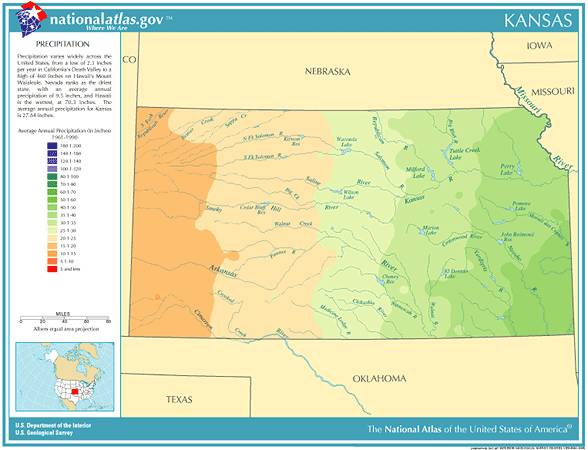
Kansas Precipitation Records
- Driest location ranked by lowest annual precipitation: Big Bow, southwest Kansas, 14.60"
- Wettest location ranked by highest annual precipitation: Pittsburg, southeast Kansas, 46.01"
- Snowiest location ranked by highest annual snowfall: McDonald, northwest Kansas, 46.0"
- State precipitation record for 24 hours - Pittsburg, southeast Kansas, 9/24-25/1993, 17.00"
- State precipitation record for 1 year - Blaine, northeast Kansas, 1993, 68.55"
- State snowfall record for 24 hours - Ft. Scott, southeast Kansas, 12/28-29/1954, 26.0"
- State snowfall record for 1 season - McDonald, northwest Kansas, 1983-1984, 103.6"
- In Topeka, Kansas, 70% of the annual precipitation falls from April through September
- On March 24, 1912 Kansas City began to dig out from a storm produced 25 inches of snow in just 24 hours. The snowfall total was nearly twice that of any other storm on record in Kansas City before or since that time. A record 40 inches of snow fell during the month of March that year and the total for the winter season of 67 inches was also a record
- The town of Codell, Kansas was struck by a tornado on the same date three years in a row.
A tornado hit on May 20, 1916, 1917 and 1918. The U.S. experiences 100,000 thunderstorms a year and less than 1% produce a tornado. The odds of this coincidence is extremely small
- Kansas temperature averages and extremes, precipitation and temperature data for all U.S. states and interesting Top 10 U.S. climate extremes
Data sources: National Climatic Data Center, Severe thunderstorm / tornado watch data period is 1999 - 2008, NOAA Storm Prediction Center, Tornado climate data - NOAA Storm Prediction Center, State lightning flash density average - 1997-2011, Vaisala