 Louisiana
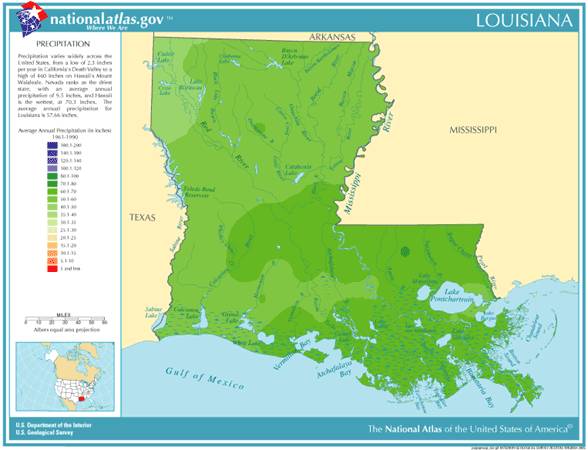
Annual Rainfall and Climate Data, see below for individual
cities
Louisiana
Annual Rainfall and Climate Data, see below for individual
cities
Louisiana
Annual Rainfall and Climate Data, see below for individual
cities
Louisiana city precipitation totals
| City |
Avg Annual Precip |
Avg Annual Snow |
Avg # days of Precip |
Avg # thunderstorm days |
Avg # hail days |
Avg # severe thunderstorm watches per year | Avg # tornado watches per year | # of tornadoes reported in parish, 1960-2010 |
| Baton Rouge | 63.08 | 0.2 | 110 | 72 | 1 | 12 | 6 | 32 |
| Lake Charles | 57.19 | 0.3 | 103 | 76 | 1 | 12 | 7 | 70 |
| New Orleans | 64.19 | 0.2 | 114 | 69 | 1 | 11 | 3 | 13 |
| Shreveport | 51.30 | 1.5 | 98 | 57 | 2 | 8 | 14 | 59 |
|
||||||||
Louisiana Precipitation Records
- Driest location ranked by lowest annual average precipitation: Red River Lock #1, central Louisiana, 46.46"
- Wettest location ranked by highest annual average precipitation: Thibodaux, southeastern Louisiana, 69.95"
- Snowiest location ranked by highest annual average snowfall: Plain Dealing, northeastern Louisiana, 1.9"
- State precipitation maximum for 24 hours - Hackberry, southwestern Louisiana, 8/29/1962, 22.00"
- State precipitation maximum for 1 year - New Orleans, southeastern Louisiana, 1991, 113.74"
- State snow maximum for 24 hours - Rayne, south-central Louisiana, 2/14-15-1895, 24.0"
- State snow maximum for 1 season - Rayne, south-central Louisiana, 1894-1895, 24.0"
- On August 31, 2005 during Hurricane Katrina, 80% of New Orleans was flooded, with some parts of the city under 15 feet of water
- Rains of as much as 20 inches in a month have occurred in most Louisiana cities, and rainfall as much as 10 inches in 24 hours are not rare. Only Hawaii averages more annual precipitation than Louisiana
- Louisiana temperature averages and extremes, precipitation and temperature data for all U.S. states and interesting Top 10 U.S. climate extremes
Data sources: National Climatic Data Center, Severe thunderstorm / tornado watch data period is 1999 - 2008, NOAA Storm Prediction Center, Tornado climate data - NOAA Storm Prediction Center, State lightning flash density average - 1997-2011, Vaisala