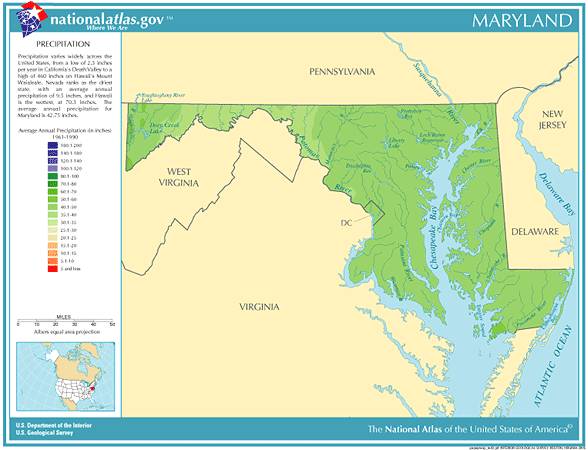
 Maryland
Annual
Rainfall and Climate Data, see below for
individual
cities
 Maryland
Annual
Rainfall and Climate Data, see below for
individual
cities

Maryland city precipitation totals
| City |
Avg Annual Precip |
Avg Annual Snow |
Avg # days of Precip |
Avg # thunderstorm days |
Avg # hail days |
Avg # severe thunderstorm watches per year | Avg # tornado watches per year | # of tornadoes reported in county, 1960-2010 |
| Baltimore | 41.94 | 21.5 | 113 | 27 | 1 | 3 | 12 | 2 |
| Hagerstown | 44.10 | 28.2 | 115 | 35 | 1 | 2 | 12 | 13 |
|
||||||||
Maryland Precipitation Records
- Driest location ranked by lowest annual average precipitation: Cumberland, central Maryland, 37.21"
- Wettest location ranked by highest annual average precipitation: Benson, northeastern Maryland, 49.77"
- Snowiest location ranked by highest annual average snowfall: Oakland, western Maryland, 95.9"
- State precipitation maximum for 24 hours - Jewell, central Maryland, 7/26/1897, 14.75"
- State precipitation maximum for 1 year - Salisbury, southeastern Maryland, 1948, 72.59"
- State snow maximum for 24 hours - Clear Spring, northwestern Maryland, 3/29/1942, 31.0"
- State snow maximum for 1 season - Deer Park, western Maryland, 1902-1902, 174.9"
- Since 1870, Baltimore has encountered 20 snowstorms of 12 inches or greater
- During the 1949-1950 winter season, Baltimore experienced only .7 inches of snow, the lowest total for 1 season in history. In contrast, Baltimore endured its highest month of snowfall ever with 40.5" during February 2003.
- The winter of 2009-2010 was the snowiest season ever in Baltimore, with the city receiving 77.0 inches. This broke the previous record of 62.95 inches set in 1995-1996
- Maryland temperature averages and extremes, Baltimore extremes/averages, precipitation and temperature data for all U.S. states and interesting Top 10 U.S. climate extremes
Data sources: National Climatic Data Center, Severe thunderstorm / tornado watch data period is 1999 - 2008, NOAA Storm Prediction Center, Tornado climate data - NOAA Storm Prediction Center, State lightning flash density average - 1997-2011, Vaisala