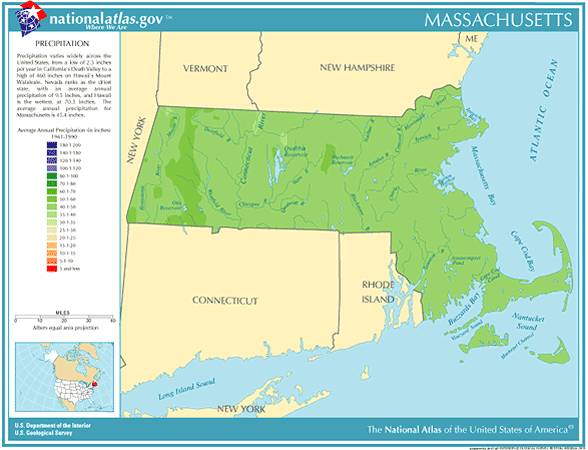
 Massachusetts
Annual Rainfall and Climate Data, see below for individual
cities
 Massachusetts
Annual Rainfall and Climate Data, see below for individual
cities

Massachusetts city precipitation totals
| City |
Avg Annual Precip |
Avg Annual Snow |
Avg # days of Precip |
Avg # thunderstorm days |
Avg # hail days |
Avg # severe thunderstorm watches per year | Avg # tornado watches per year | # of tornadoes reported in county, 1960-2010 |
| Blue Hill | 51.22 | 60.8 | 134 | 15 | 0 | 0 | 6 | 7 |
| Boston | 42.53 | 43.2 | 126 | 18 | 1 | 0 | 5 | 0 |
| Worcester | 49.05 | 69.1 | 133 | 23 | 1 | 0 | 8 | 24 |
|
||||||||
Massachusetts Precipitation Records
Data sources: National Climatic Data Center, severe thunderstorm / tornado watch data period is 1999 - 2008, NOAA Storm Prediction Center, Tornado climate data - NOAA Storm Prediction Center
State lightning flash density average - 1997-2011, Vaisala