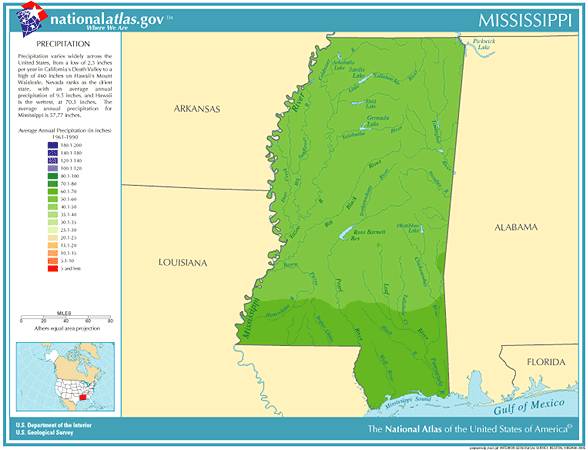
 Mississippi
Annual Rainfall and Climate Data, see below for individual
cities
 Mississippi
Annual Rainfall and Climate Data, see below for individual
cities

Mississippi city precipitation totals
| City | Avg Annual Precip | Avg Annual Snow | Avg. days of Precip | Avg # thunderstorm days | Avg # hail days | Avg # severe thunderstorm watches per year | Avg # tornado watches per year | # of tornadoes reported in county, 1960-2010 |
| Jackson | 55.95 | 1.0 | 110 | 68 | 1 | 13 | 8 | 57 |
| Meridian | 58.65 | 1.2 | 106 | 59 | 1 | 14 | 8 | 36 |
| Tupelo | 55.86 | 2.8 | 109 | 58 | 1 | 10 | 8 | 19 |
|
||||||||
Mississippi Precipitation Records
- Driest location ranked by lowest annual average precipitation: Cleveland, northwest Mississippi, 50.97"
- Wettest location ranked by highest annual average precipitation: Vancleave, southeast Mississippi, 72.10"
- Snowiest location ranked by highest annual average snowfall: Cleveland, northwest Mississippi, 4.9"
- State precipitation record for 24 hours - Fort Ripley, central Minnesota, 7/21-22/1972, 10.84"
- State precipitation record for 1 year - Waveland, southern Mississippi, 1991, 104.36"
- State snowfall record for 24 hours - Mt. Pleasant, northern Mississippi, 12/23/1963, 18.0"
- State snow record for 1 season - Senatobia, northern Mississippi, 1967-1968, 25.2"
- With a state annual average of 59.23 inches of precipitation, Mississippi is the third wettest U.S. state
- 95% of Mississippi's weather reporting stations average over 50 inches of precipitation annually. Only Hawaii and Louisiana receive more precipitation than Mississippi
- Measurable snow or sleet falls on some part of of Mississippi in 95 % of all years
- During the year 2011, Mississippi experienced an all-time record 136 tornado reports, breaking the previous record during 2009 when only 109 were reported.
- The Gulf Coast of Mississippi suffered near total devastation from Hurricane Katrina on August 28-29, 2005 with hurricane winds, 28-foot storm surge and 55-foot sea waves pushing casino barges, boats and debris into towns, leaving an estimated $125 billion in damages
- Mississippi temperature averages and extremes, precipitation and temperature data for all U.S. states and Top 10 U.S. climate extremes
Data
sources: National
Climatic Data Center, severe thunderstorm / tornado watch
data period is 1999 - 2008, NOAA
Storm Prediction Center, Tornado climate data - NOAA
Storm Prediction Center
State lightning flash density average - 1997-2011, Vaisala