 Montana Annual
Rainfall and Climate Data, see below for individual
cities
Montana Annual
Rainfall and Climate Data, see below for individual
cities
Montana Annual
Rainfall and Climate Data, see below for individual
cities
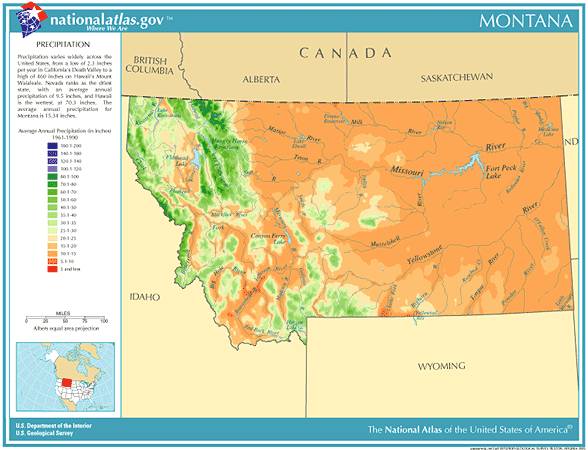
Montana city precipitation totals
| City | Avg Annual Precip | Avg Annual Snow | Avg. days of Precip | Avg # thunderstorm days | Avg # hail days | Avg # severe thunderstorm watches per year | Avg # tornado watches per year | # of tornadoes reported in county, 1960-2010 |
| Billings | 14.77 | 56.4 | 96 | 27 | 3 | 2 | 9 | 15 |
| Glasgow | 11.23 | 30.8 | 90 | 20 | 1 | 2 | 9 | 35 |
| Great Falls | 14.89 | 58.3 | 101 | 25 | 2 | 0 | 6 | 11 |
| Havre | 11.46 | 43.1 | 90 | 20 | 1 | 1 | 5 | 6 |
| Helena | 11.32 | 46.4 | 96 | 30 | 3 | 0 | 5 | 3 |
| Kalispell | 17.21 | 64.0 | 132 | 23 | 2 | 0 | 3 | 4 |
| Missoula | 13.82 | 45.4 | 123 | 23 | 1 | 0 | 3 | 2 |
|
||||||||
Montana Precipitation Records
- Driest location ranked by lowest annual average precipitation: Belfry, southern Montana, 6.85"
- Wettest location ranked by highest annual average precipitation: Many Glacier, northwest Montana, 40.85"
- Snowiest location ranked by highest annual average snowfall: Kings Hill, central Montana, 305.5"
- State precipitation record for 24 hours - Circle, northeast Montana, 6/19-20/1921, 11.50"
- State precipitation record for 1 year - Summit, northwest Montana, 1953, 55.51"
- State snowfall record for 24 hours - Shonkin, central Montana, 5/28-29/1982, 48.0"
- State snow record for 1 season - Cooke City, southern Montana, 1977-1978, 418.1"
- On average, nearly 50% of Montana's annual precipitation falls during the three months of May through July
- Montana temperature averages and extremes, precipitation and temperature data for all U.S. states and interesting Top 10 U.S. climate extremes
Data sources: National Climatic Data Center, Severe thunderstorm / tornado watch data period is 1999 - 2008, NOAA Storm Prediction Center, Tornado climate data - NOAA Storm Prediction Center, State lightning flash density average - 1997-2011, Vaisala