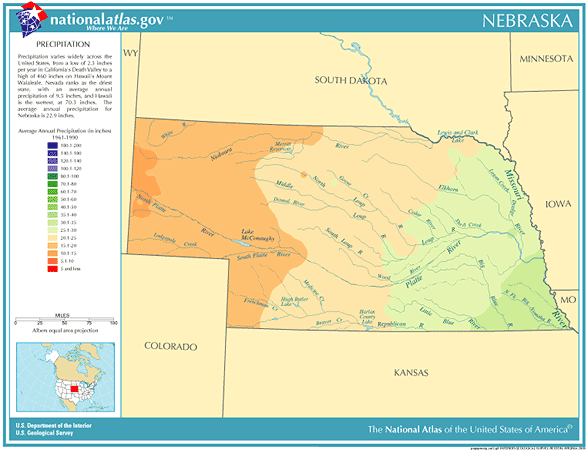
Nebraska Annual Rainfall and Climate Data, see below for individual cities 


Nebraska city precipitation totals

City Avg Annual Precip Avg Annual Snow Avg. days of Precip Avg # thunderstorm days Avg # hail days Avg # severe thunderstorm watches per year Avg # tornado watches per year # of tornadoes reported in county, 1960-2010
Grand Island 25.89 30.6 87 46 3 8 16 68
Lincoln 28.37 28.4 93 46 2 8 16 25
Norfolk 26.66 30.1 91 50 3 7 15 28
North Platte 19.66 29.8 84 46 3 7 20 81
Omaha 30.22 30.5 99 46 3 8 14 13
Scottsbluff 16.33 41.2 87 45 4 3 9 47
Valentine 19.52 33.6 83 76 3 5 19 69
  • Nebraska Annual Precipitation - 23.63 inches, 38th wettest state in the U.S.
  • Nebraska Tornado Average - 38.0 per year - 5th most in the U.S. 
  • Largest reported Tornado in Nebraska from 1950-2011, 5/22/2004 - 4,400 yards / 2.5 miles wide
  • Date with highest number of reported Tornadoes in Nebraska from 1950-2011, May 22nd - 63 tornadoes
  • Average time of occurrence of reported Tornadoes in Nebraska from 1950-2011 - 5:15 pm
  • Nebraska Annual Lightning Density - 7.3 flashes per square mile - 23rd highest in U.S.
  • Record Driest year in Nebraska from 1895-2012 - 2012, avg precipitation 13.04 inches 
  • Record Wettest year in Nebraska from 1895-2012 - 1915, avg precipitation 35.84 inches

Nebraska Precipitation Records

  • Driest location ranked by lowest annual average precipitation: Mitchell, western Nebraska, 13.22"
  • Wettest location ranked by highest annual average precipitation: Falls City, southeastern Nebraska, 35.08"
  • Snowiest location ranked by highest annual average snowfall: Mullen, west-central Nebraska, 59.3"
  • State precipitation record for 24 hours - York, southeastern Nebraska, 7/8/1950, 13.15"
  • State precipitation record for 1 year - Omaha, eastern Nebraska, 1869, 64.52"
  • State snowfall record for 24 hours - Dalton, southeastern Nebraska, 12/21/2006, 27.0"
  • State snow record for 1 season - Harrison, western Nebraska, 1973-1973, 112.0"
  • Of the Nebraska yearly total, 75 to 80 percent of precipitation falls during the warm half–year, April through September
  • In North America, hail is most common in the area where Colorado, Nebraska, and Wyoming meet, known as "Hail Alley"
  • Nebraska temperature averages and extremes, precipitation and temperature data for all U.S. states and interesting Top 10 U.S. climate extremes

Data sources: National Climatic Data Center, Severe thunderstorm / tornado watch data period is 1999 - 2008, NOAA Storm Prediction Center, Tornado climate data - NOAA Storm Prediction Center, State lightning flash density average - 1997-2011, Vaisala