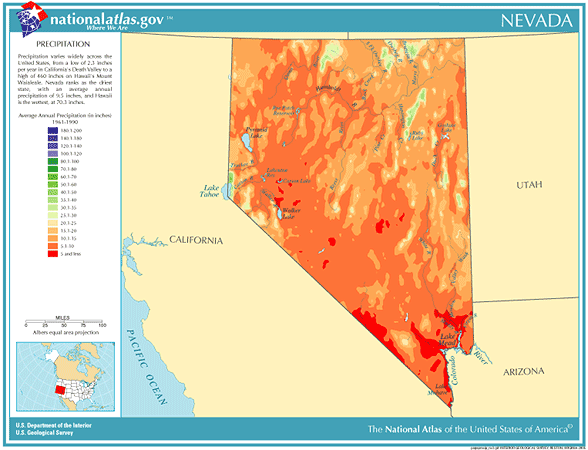
 Nevada Annual
Rainfall and Climate Data, see below for individual
cities
 Nevada Annual
Rainfall and Climate Data, see below for individual
cities

Nevada city precipitation totals
| City | Avg Annual Precip | Avg Annual Snow | Avg # days of Precip |
Avg # thunderstorm days |
Avg # hail days | Avg # severe thunderstorm watches per year | Avg # tornado watches per year | # of tornadoes reported in county, 1960-2010 |
| Elko | 9.59 | 39.0 | 78 | 19 | 2 | 0 | 1 | 16 |
| Ely | 9.97 | 49.3 | 74 | 30 | 1 | 0 | 1 | 10 |
| Las Vegas | 4.49 | 1.2 | 26 | 13 | 0 | 0 | 1 | 11 |
| Reno | 7.48 | 25.0 | 50 | 14 | 1 | 0 | 0 | 12 |
| Winnemucca | 8.33 | 23.2 | 68 | 17 | 1 | 0 | 1 | 5 |
|
||||||||
Nevada Precipitation Records
- Driest location ranked by lowest annual average precipitation: Indian Springs, northwestern Nevada, 2.91"
- Wettest location ranked by highest annual average precipitation: Mount Rose, northwestern Nevada, 30.60"
- Snowiest location ranked by highest annual average snowfall: Marlett Lake, western Nevada, 241.0"
- State precipitation record for 24 hours - Cloverdale Ranch, southern Nevada,5/29/1896, 8.06"
- State precipitation record for 1 year - Mount Rose, northwestern Nevada, 1969, 59.03"
- State snowfall record for 24 hours - Hickman, southeastern Nebraska, 2/11/1965, 24.0"
- State snow record for 1 season - Daggett Pass, northwestern Nevada, 1968-1969, 412.0"
- The record at Las Vegas for consecutive days without measurable precipitation is 150 days, from 2/22/1959-7/21/1959 while the record for consecutive days with measurable precipitation is only 6 days, from 2/24/2003-3/1/2003
- From January through December, there are only 22 days when the daily precipitation record exceeds 1.00" at Las Vegas
- Although Reno averages 72 days of rain per year, it is usually very light and less than 1/2 inch. The city averages only 1 day per year with rainfall above 1/2 inch in one day
- Nevada possesses 22 of the Top 25 driest years for any state. The record driest year was 1929, when the state averaged only 4.88 inches of rainfall.
- Nevada temperature averages and extremes, precipitation and temperature data for all U.S. states and interesting Top 10 U.S. climate extremes
Data sources: National Climatic Data Center, Severe thunderstorm / tornado watch data period is 1999 - 2008, NOAA Storm Prediction Center, Tornado climate data - NOAA Storm Prediction Center, State lightning flash density average - 1997-2011, Vaisala