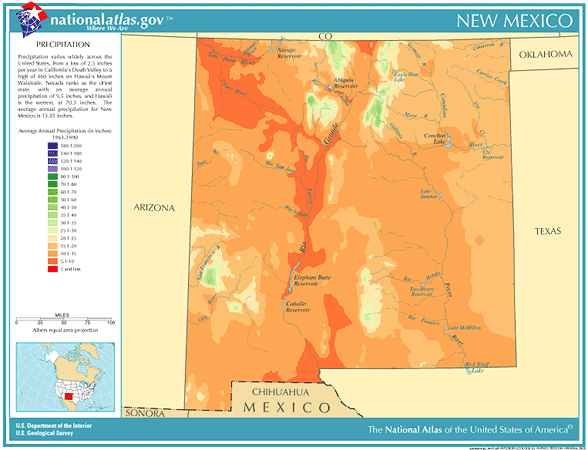
 New Mexico
Annual Rainfall and Climate Data, see below for individual
cities
 New Mexico
Annual Rainfall and Climate Data, see below for individual
cities

New Mexico city precipitation totals
| City | Avg Annual Precip | Avg Annual Snow | Avg # days of Precip |
Avg # thunderstorm days |
Avg # hail days | Avg # severe thunderstorm watches per year | Avg # tornado watches per year | # of tornadoes reported in county, 1960-2010 |
| Albuquerque | 9.47 | 11.3 | 61 | 38 | 2 | 0 | 1 | 9 |
| Clayton | 15.13 | 23.2 | 68 | 69 | 7 | 2 | 11 | 36 |
| Roswell | 13.34 | 11.9 | 56 | 38 | 2 | 2 | 7 | 42 |
|
||||||||
New Mexico Precipitation Records
- Driest location ranked by lowest annual average precipitation: Newcomb, southwestern New Mexico, 5.96"
- Wettest location ranked by highest annual average precipitation: Cloudcroft, southern New Mexico, 28.19"
- Snowiest location ranked by highest annual average snowfall: Red River, northern New Mexico, 164.9"
- State precipitation record for 24 hours - Lake Maloya, northern New Mexico, 5/19/1955, 11.28"
- State precipitation record for 1 year - White Tail, southern New Mexico, 1941, 62.45"
- State snowfall record for 24 hours - Dulce, northern New Mexico, 11/22/1931, 36.0"
- State snow record for 1 season - Anchor Mine, northern New Mexico, 1911,1912, 483.0"
- Average annual snowfall in New Mexico ranges from about 3 inches at the Southern Desert and Southeastern Plains stations to well over 100 inches at Northern Mountain stations. Totals can exceed 300 inches in the highest mountains of the north
- On February 4, 1989, a powerful winter storm produced up to 84 inches at the ski resorts of northern New Mexico in just 3 days
- New Mexico temperature averages and extremes, Albuquerque climate extremes/averages, precipitation and temperature data for all U.S. states and interesting Top 10 U.S. climate extremes
Data sources: National Climatic Data Center, Severe thunderstorm / tornado watch data period is 1999 - 2008, NOAA Storm Prediction Center, Tornado climate data - NOAA Storm Prediction Center, State lightning flash density average - 1997-2011, Vaisala