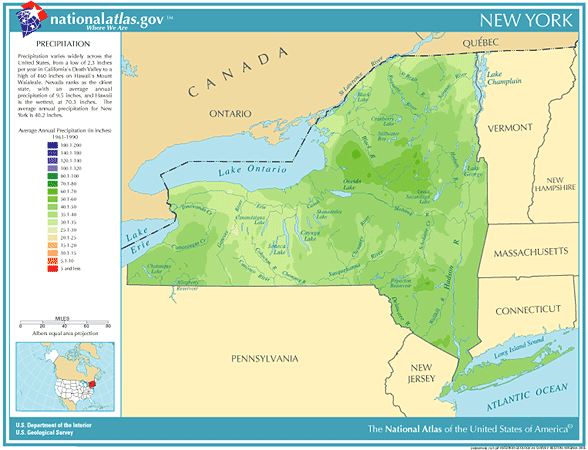
 New York Annual
Rainfall and Climate Data, see below for individual
cities
 New York Annual
Rainfall and Climate Data, see below for individual
cities

New York city precipitation totals
| City | Avg Annual Precip | Avg Annual Snow | Avg. # days of Precip |
Avg # thunderstorm days |
Avg # hail days | Avg # severe thunderstorm watches per year | Avg # tornado watches per year | # of tornadoes reported in county, 1960-2010 |
| Albany | 38.60 | 63.8 | 135 | 24 | 1 | 1 | 11 | 7 |
| Binghamton | 38.65 | 84.9 | 162 | 29 | 1 | 1 | 11 | 8 |
| Buffalo | 40.54 | 93.7 | 169 | 30 | 1 | 1 | 5 | 17 |
| Islip | 46.52 | 25.7 | 116 | 26 | 0 | 0 | 5 | 19 |
| New York City (JFK) | 42.46 | 23.9 | 118 | 23 | 0 | 0 | 7 | 1 |
| Rochester | 33.98 | 92.6 | 159 | 27 | 1 | 1 | 6 | 3 |
| Syracuse | 40.05 | 117.5 | 171 | 27 | 1 | 1 | 9 | 8 |
|
||||||||
New York Precipitation Records
- Driest location ranked by lowest annual average precipitation: Chazy, northeastern New York, 30.25"
- Wettest location ranked by highest annual average precipitation: Slide Mountain, southern New York, 63.61"
- Snowiest location ranked by highest annual average snowfall: Old Forge, central New York, 226.7"
- State precipitation record for 24 hours - Brewster, southeastern New York, 9/16/1999, 13.70"
- State precipitation record for 1 year - Slide Mountain, southern New York, 1996, 90.97"
- State snowfall record for 24 hours - Adams, northern New York, 1/9/1976, 68.0"
- State snow record for 1 season - Hooker, north-central New York, 1976-1977, 466.9"
- On 1/26/1972, Oswego in north-central New York received the current U.S. record snowfall of 9.1" in just one hour and 27.0" in only 3.5 hours
- The average for winter season snowfall in New York is over 40 inches
- On January 21, 1985, three days of snow squalls at Buffalo, New York finally came to an end. The squalls, induced by relatively warm water in Lake Erie, produced 34 inches of snow at the International Airport, with up to 47 inches reported in the suburbs of Buffalo. The New York "Blizzard of 85" left many counties disaster areas
- New York temperature averages and extremes, New York City climate records, precipitation/temperature data for all U.S. states and interesting Top 10 U.S. climate extremes
Data sources: National Climatic Data Center, Severe thunderstorm / tornado watch data period is 1999 - 2008, NOAA Storm Prediction Center, Tornado climate data - NOAA Storm Prediction Center, State lightning flash density average - 1997-2011, Vaisala