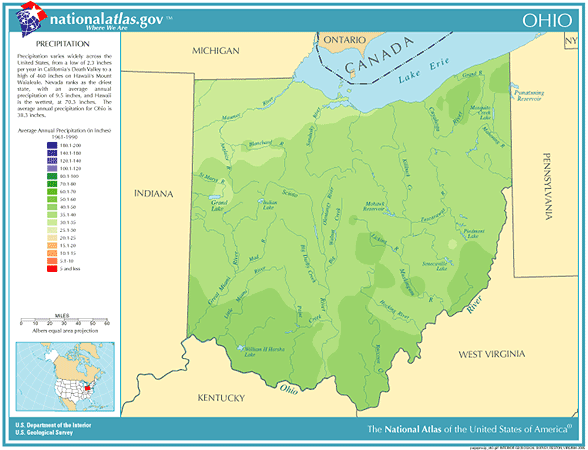
 Ohio
Annual
Rainfall and Climate Data, see below for
individual
cities
 Ohio
Annual
Rainfall and Climate Data, see below for
individual
cities

Ohio city precipitation totals
| City |
Avg Annual Precip |
Avg Annual Snow |
Avg # days of Precip |
Avg # thunderstorm days |
Avg # hail days | Avg # severe thunderstorm watches per year | Avg # tornado watches per year | # of tornadoes reported in county, 1960-2010 |
| Akron | 38.47 | 47.1 | 155 | 38 | 2 | 1 | 11 | 11 |
| Cleveland | 38.71 | 58.6 | 156 | 34 | 1 | 1 | 10 | 11 |
| Columbus | 38.52 | 28.1 | 137 | 40 | 2 | 3 | 15 | 24 |
| Dayton | 39.58 | 27.5 | 132 | 38 | 1 | 4 | 13 | 8 |
| Mansfield | 43.24 | 43.6 | 143 | 35 | 1 | 2 | 12 | 26 |
| Toledo | 33.21 | 37.1 | 136 | 37 | 1 | 3 | 12 | 7 |
| Youngstown | 38.02 | 56.8 | 160 | 33 | 1 | 1 | 11 | 12 |
|
||||||||
Ohio Precipitation Records
sunshine is received only about 30% of the time, with only three to six clear days. This compares to the
well-known cloudy city of Seattle, Washington which also experiences only three to five clear days during December
northwest, to over 90 inches in the extreme northeastern counties where lake effect snowfall dominates
data for all U.S. states and interesting Top 10 U.S. climate extremesData sources: National Climatic Data Center, Severe thunderstorm / tornado watch data period is 1999 - 2008, NOAA Storm Prediction Center, Tornado climate data - NOAA Storm Prediction Center, State lightning flash density average - 1997-2011, Vaisala