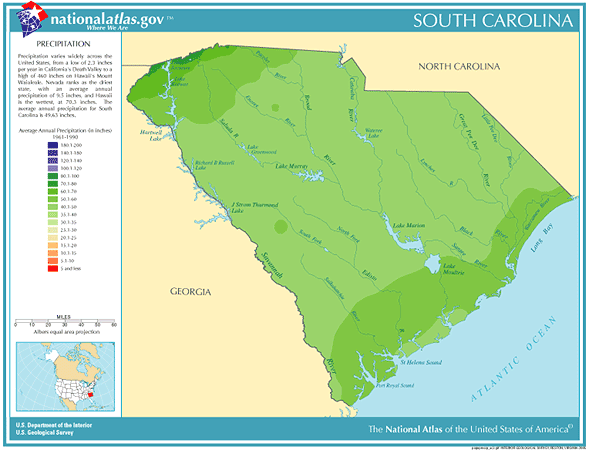
South Carolina Annual Rainfall and Climate Data, see below for individual cities 


South Carolina city precipitation totals

City

Avg Annual Precip

Avg Annual Snow 

Avg. days of Precip

Avg # thunderstorm days

Avg # hail days Avg # severe thunderstorm watches per year Avg # tornado watches per year # of tornadoes reported in county, 1960-2010
Charleston 51.53 0.7 113 58 1 7 6 37
Columbia 48.27 1.9 109 53 1 6 9 33
Greenville 50.24 6.5 117 46 1 4 8 21
  • South Carolina Annual Precipitation Average - 49.84", 11th wettest in the U.S.
  • South Carolina Tornado Average - 9.6 per year - 26th most in the U.S.
  • Largest reported Tornado in South Carolina from 1950-2011, 3/28/1984 - 2,600 yards / 1.4 miles wide
  • Date with highest number of reported Tornadoes in South Carolina from 1950-2011, September 7th - 44 tornadoes
  • Average time of occurrence of reported Tornadoes in South Dakota from 1950-2011 - 3:17pm
  • South Carolina Annual Lightning Density - 14.6 flashes per square mile - 8th highest in U.S.
  • Record Driest year in South Carolina from 1895-2012 - 1954, avg precipitation 32.06 inches 
  • Record Wettest year in South Carolina from 1895-2012 - 1964, avg precipitation 70.24 inches

South Carolina Precipitation Records

  • Driest location ranked by lowest annual average precipitation: McColl, northeastern South Carolina, 39.04"
  • Wettest location ranked by highest annual average precipitation: Jocassee, northern South Carolina, 84.38"
  • Snowiest location ranked by highest annual average snowfall: Caesars Head, northwestern South Carolina, 8.7"
  • State precipitation record for 24 hours - Antreville, northwestern South Carolina, 8/27/1995, 17.00"
  • State precipitation record for 1 year - Jocassee, northern South Carolina, 1994, 110.79, 
  • State snowfall record for 24 hours - Rimini, central South Carolina, 2/9-10/1973, 24.0"
  • State snow record for 1 season - Caesars Head, northwestern South Carolina, 60.3"
  • Hurricane Hugo crossed the South Carolina coast near the Isle of Palms on September 22, 1989. Surface 
    winds were recorded at 138 miles per hour, with gusts of 160+ miles per hour. Damage to coastal and inland
    properties, utilities, agriculture, timber and commerce exceeded $6 billion
  • South Carolina temperature averages and extremes, precipitation and temperature data for all U.S. states
    and interesting Top 10 U.S. climate extremes

Data sources: National Climatic Data Center, Severe thunderstorm / tornado watch data period is 1999 - 2008, NOAA Storm Prediction Center, Tornado climate data - NOAA Storm Prediction Center, State lightning flash density average - 1997-2011, Vaisala