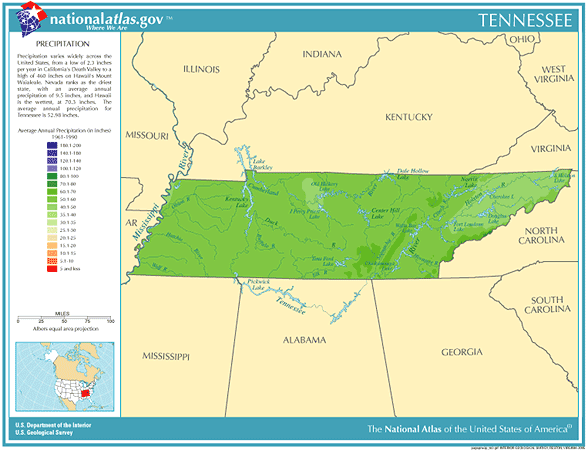
 Tennessee
Annual Rainfall and Climate Data, see below for
individual
cities
 Tennessee
Annual Rainfall and Climate Data, see below for
individual
cities

Tennessee city precipitation totals
| City |
Avg Annual Precip |
Avg Annual Snow |
Avg # days of Precip |
Avg # thunderstorm days |
Avg # hail days | Avg # severe thunderstorm watches per year | Avg # tornado watches per year | # of tornadoes reported in county, 1960-2010 |
| Bristol - Kingsport | 41.33 | 15.4 | 133 | 42 | 1 | 2 | 7 | 9 |
| Chattanooga | 54.52 | 4.3 | 120 | 55 | 1 | 5 | 10 | 9 |
| Knoxville | 48.22 | 11.5 | 126 | 47 | 1 | 3 | 9 | 8 |
| Memphis | 54.65 | 5.1 | 107 | 59 | 1 | 10 | 11 | 49 |
| Nashville | 48.11 | 10.0 | 119 | 54 | 2 | 7 | 10 | 26 |
| Oak Ridge | 55.05 | 9.9 | 128 | 48 | 1 | 3 | 8 | 2 |
|
||||||||
Tennessee Precipitation Records
- During the year 2011, Tennessee experienced an all-time record 75 tornado reports, breaking the previous record during 2009 when only 46 were reported.
of the state makes it likely to be affected from the remnants of tropical cyclones which weaken over land and
can cause significant rainfall
afternoon of April, 16 1998. Total damages for this tornado totaled $100+ million dollars
temperature data for all U.S. states and interesting Top 10 U.S. climate extremesData sources: National Climatic Data Center, Severe thunderstorm / tornado watch data period is 1999 - 2008, NOAA Storm Prediction Center, Tornado climate data - NOAA Storm Prediction Center, State lightning flash density average - 1997-2011, Vaisala